问题
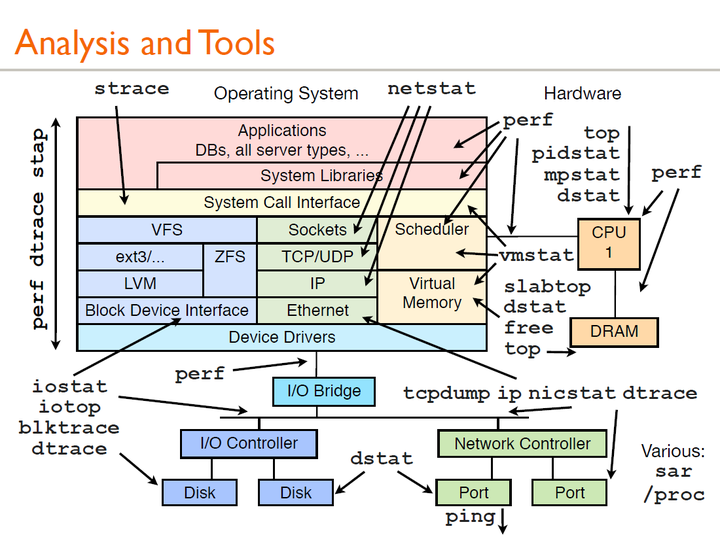
utilization, saturation, and error metrics for all resources
CPU utilization, memory usage, disk utilization, and network throughput
CPU利用率检测到目前仍然有瑕疵,部分没有指标可以导出
Block-I/O Latencies、File System Latency、CPU Scheduling Latency
参考资料:
https://www.tuicool.com/articles/aE3U7jf
系统内的
http://techblog.netflix.com/2015/11/linux-performance-analysis-in-60s.html
1 | uptime |
查看系统平均负载,会显示最近1,5,15分钟中,运行队列中的平均进程数
想要运行到CPU的进程以及被非中断性的I/O阻塞的进程
(与时间和CPU相关的指标,显示负载随时间的变化)
1 | dmesg | tail |
显示最新的10条系统消息
(与日志相关的指标,显示系统消息)
1 | vmstat 1 |
1是参数,代表每隔多少秒统计一次
虚拟内存统计,对虚拟内存,CPU,进程等整体情况进行监视。
参数解释:https://zhuanlan.zhihu.com/p/35879028
参数解释
procs:
-r- 等待CPU的进程数目
-b- 不可中断的休眠(等待IO)的进程数目。
memory:
-swapd- 多少块被换出磁盘(页面交换)
-free- 空闲的(未被使用)
-buff- 被用作缓冲区,cache - 被用作操作系统缓存。
swap:
-si- 每秒有多少块正在被换入(从磁盘)
-so- 换出(到磁盘)。
io:
-bi- 多少块从块设备读取
-bo- 多少块从块设备写出
system:
-in- 每秒中断数
-cs- 每秒上下文切换数。
cpu:显示所有的CPU时间花费在各类操作的百分比
-us- 执行用户代码(非内核)
-sy- 执行系统代码(内核)
-id- 空闲
-wa- 等待IO
1 | mpstat -P ALL 1 |
大家介绍的
github上找的
StackOverflow上的
产业界的
Atlas
https://netflixtechblog.com/introducing-atlas-netflixs-primary-telemetry-platform-bd31f4d8ed9a
Vector
外网推荐的
论文里有的
方法论
The USE Method
http://www.brendangregg.com/usemethod.html
Google’s SRE teams
ebpf的最大特点就是极低的负载
因为有了极低的负载,所以对很多之前做起来开销大的检查,现在都能够做了。